The Data Action Monitor is a special type of
monitor
that allows you to monitor the latest values in a point data file and either
execute an external program,
send an email message or a text message when the value meets a certain criteria.
This is useful for monitoring uptime or data values of real-time instruments.
A Data Monitor contains one or more entry IDs and a criteria (in Javascript) for determining
whether the action is triggered. Once an action is triggered
no other actions will be triggered until a delay has been
reached. This prevents too many actions from being triggered.
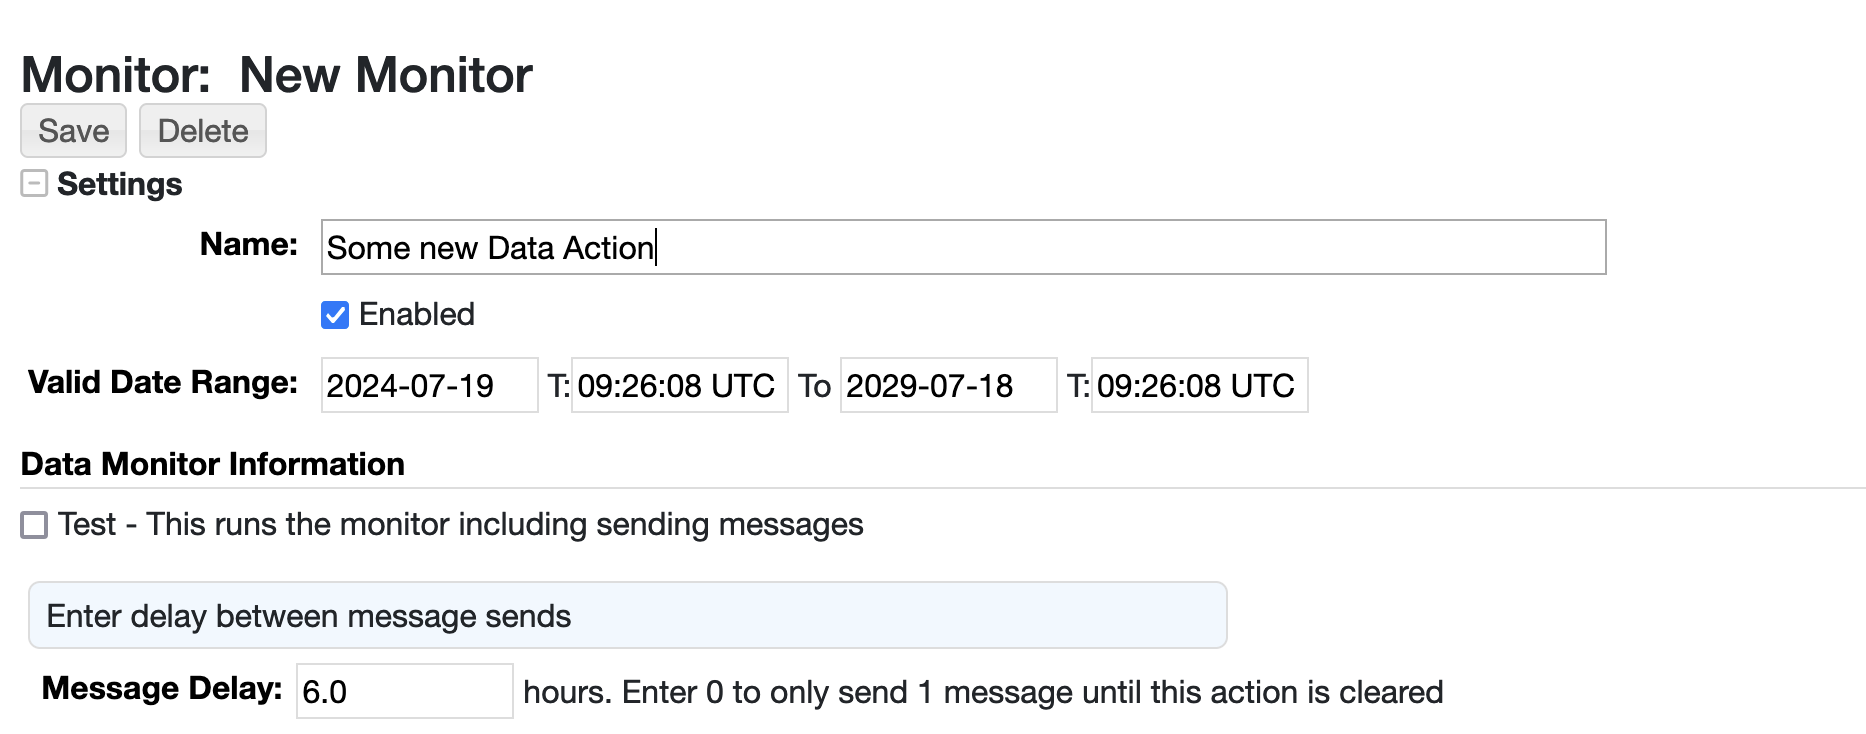
To create a Data Monitor as a site administrator go to the Admin->Monitors page.
Select "Data Action".
Specify a name, whether the action is enabled and a valid date range for when the action can run.
The message delay is the number of hours to wait between messages. This can br fractional if desired. Entering "0" will result in only one message to be sent.
The Test checkbox, when checked, will result in a single run of this Data Monitor irrespective
of the message delay when changes to the Data Monitor are saved.
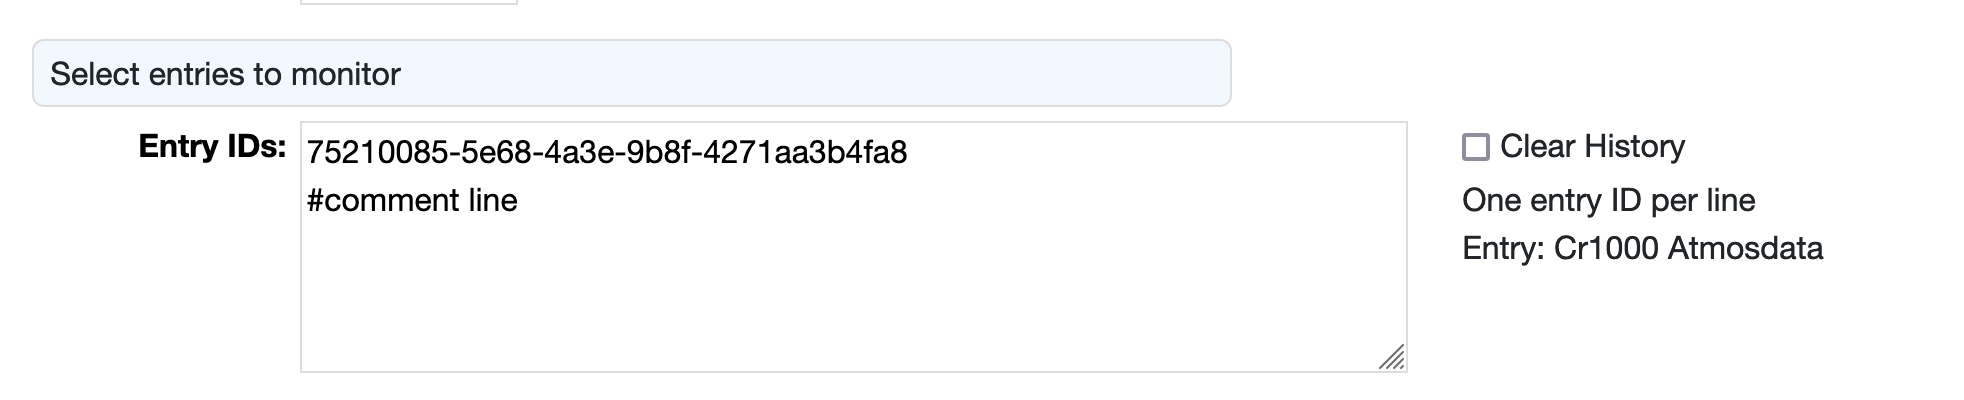
Next, specify one or more entry IDs that are to be monitored. Lines can be commented out with a "#".
Once saved the entry or entries will be shown on the right. If there has been a message sent in the past then the time of the message send and the time of the next message will be shown as well.
Selecting the "Clear" checkbox and saving the data monitor will clear any of the message sending
history.
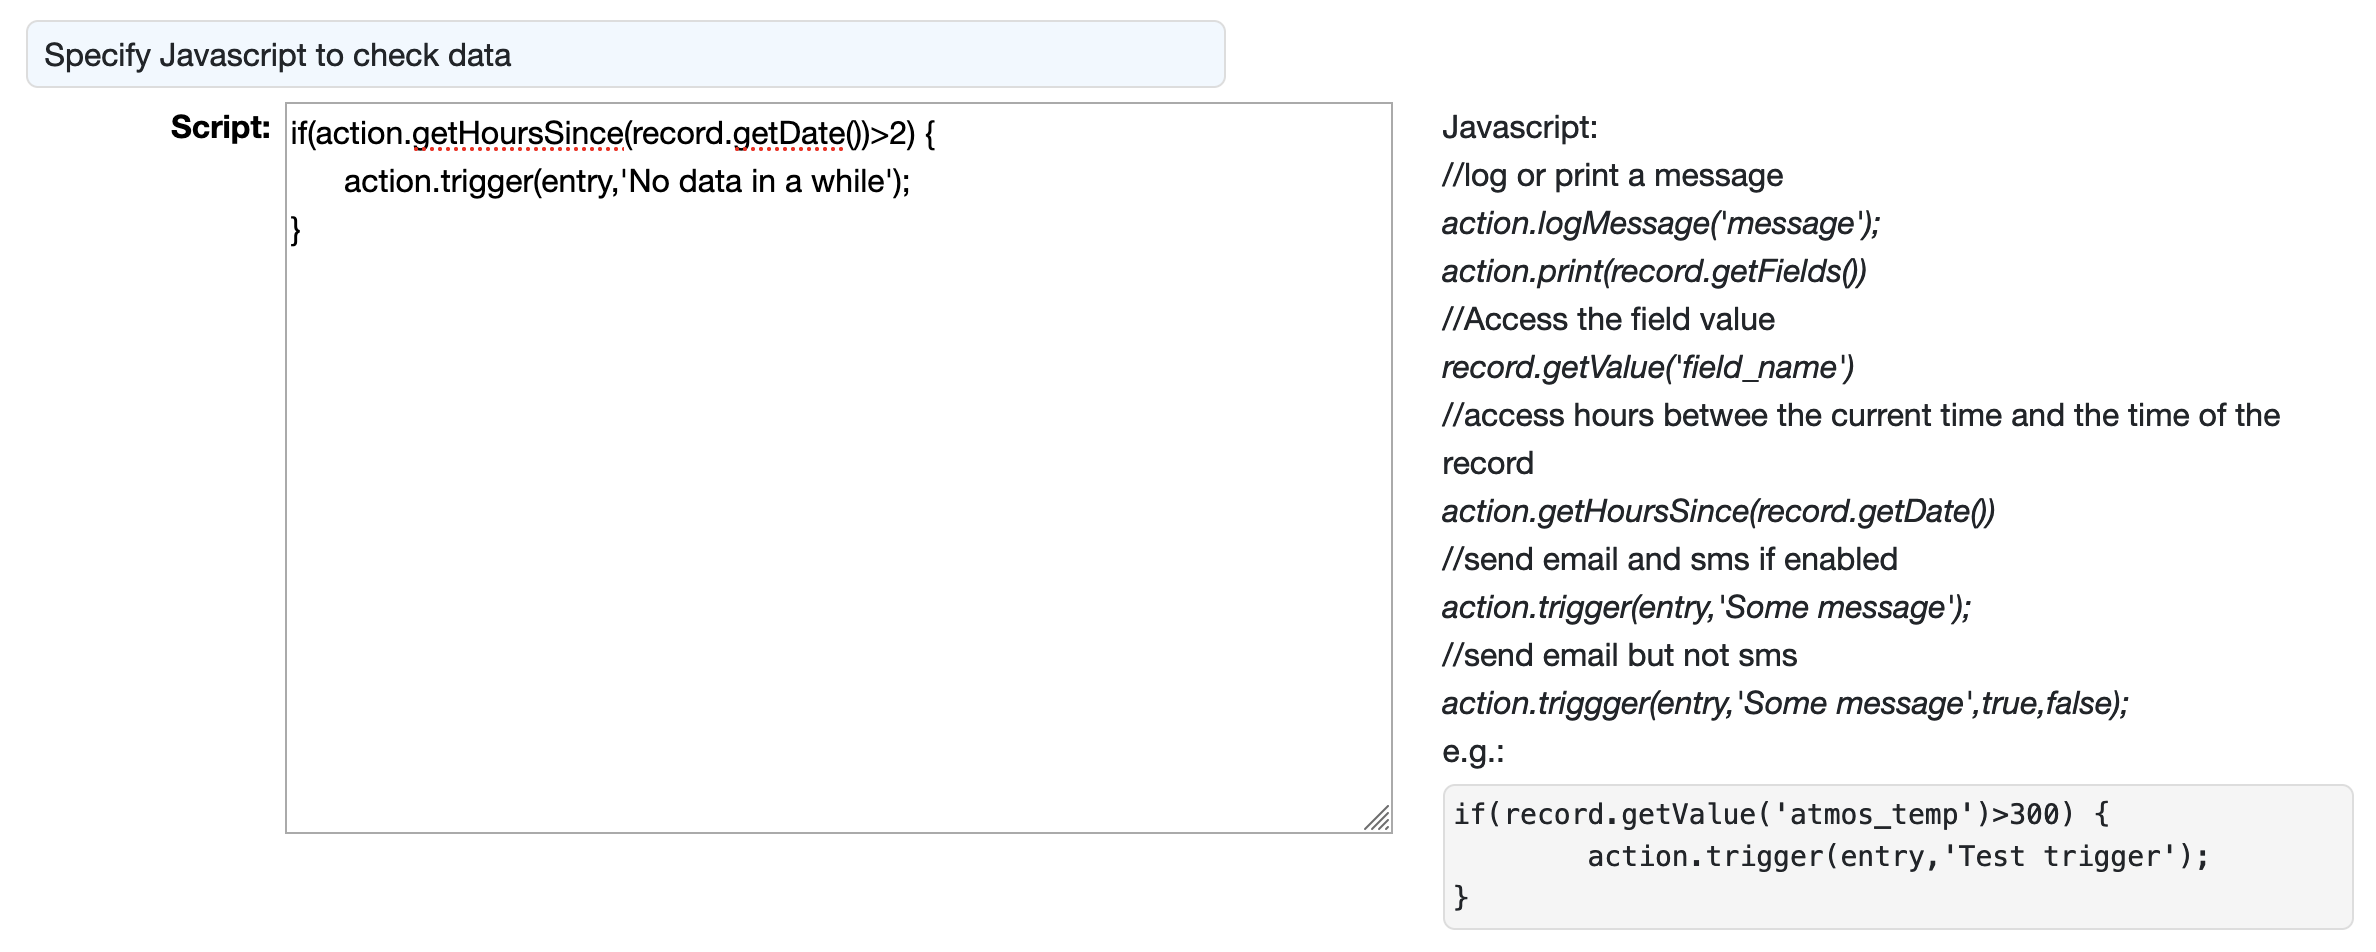
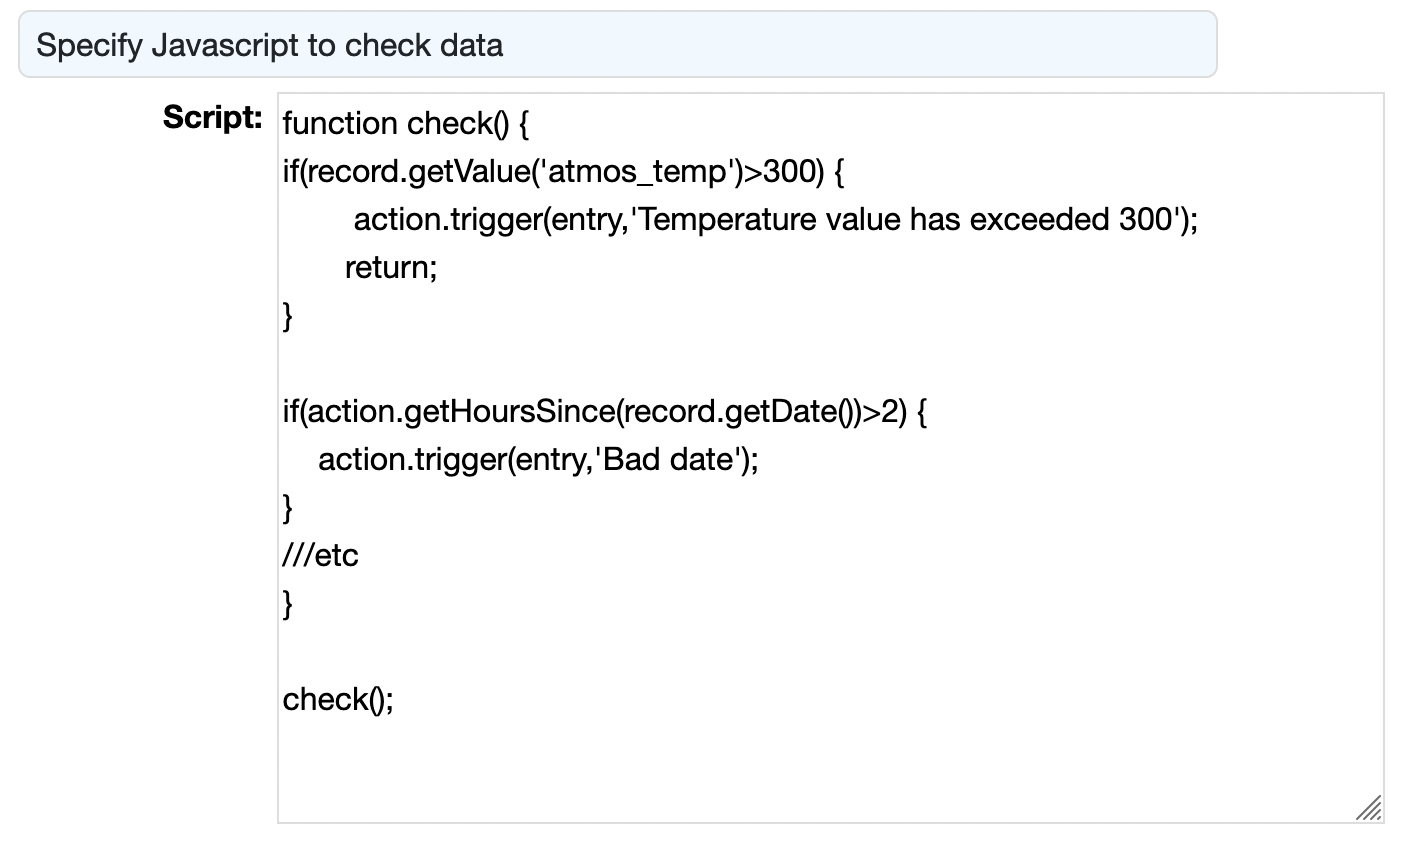
The criteria for checking the values of a data file and triggering actions is specified
using Javascript that runs on RAMADDA. On the right of the form is a set of available commands.
For example to check if the time latest record is older than 2 hours do:
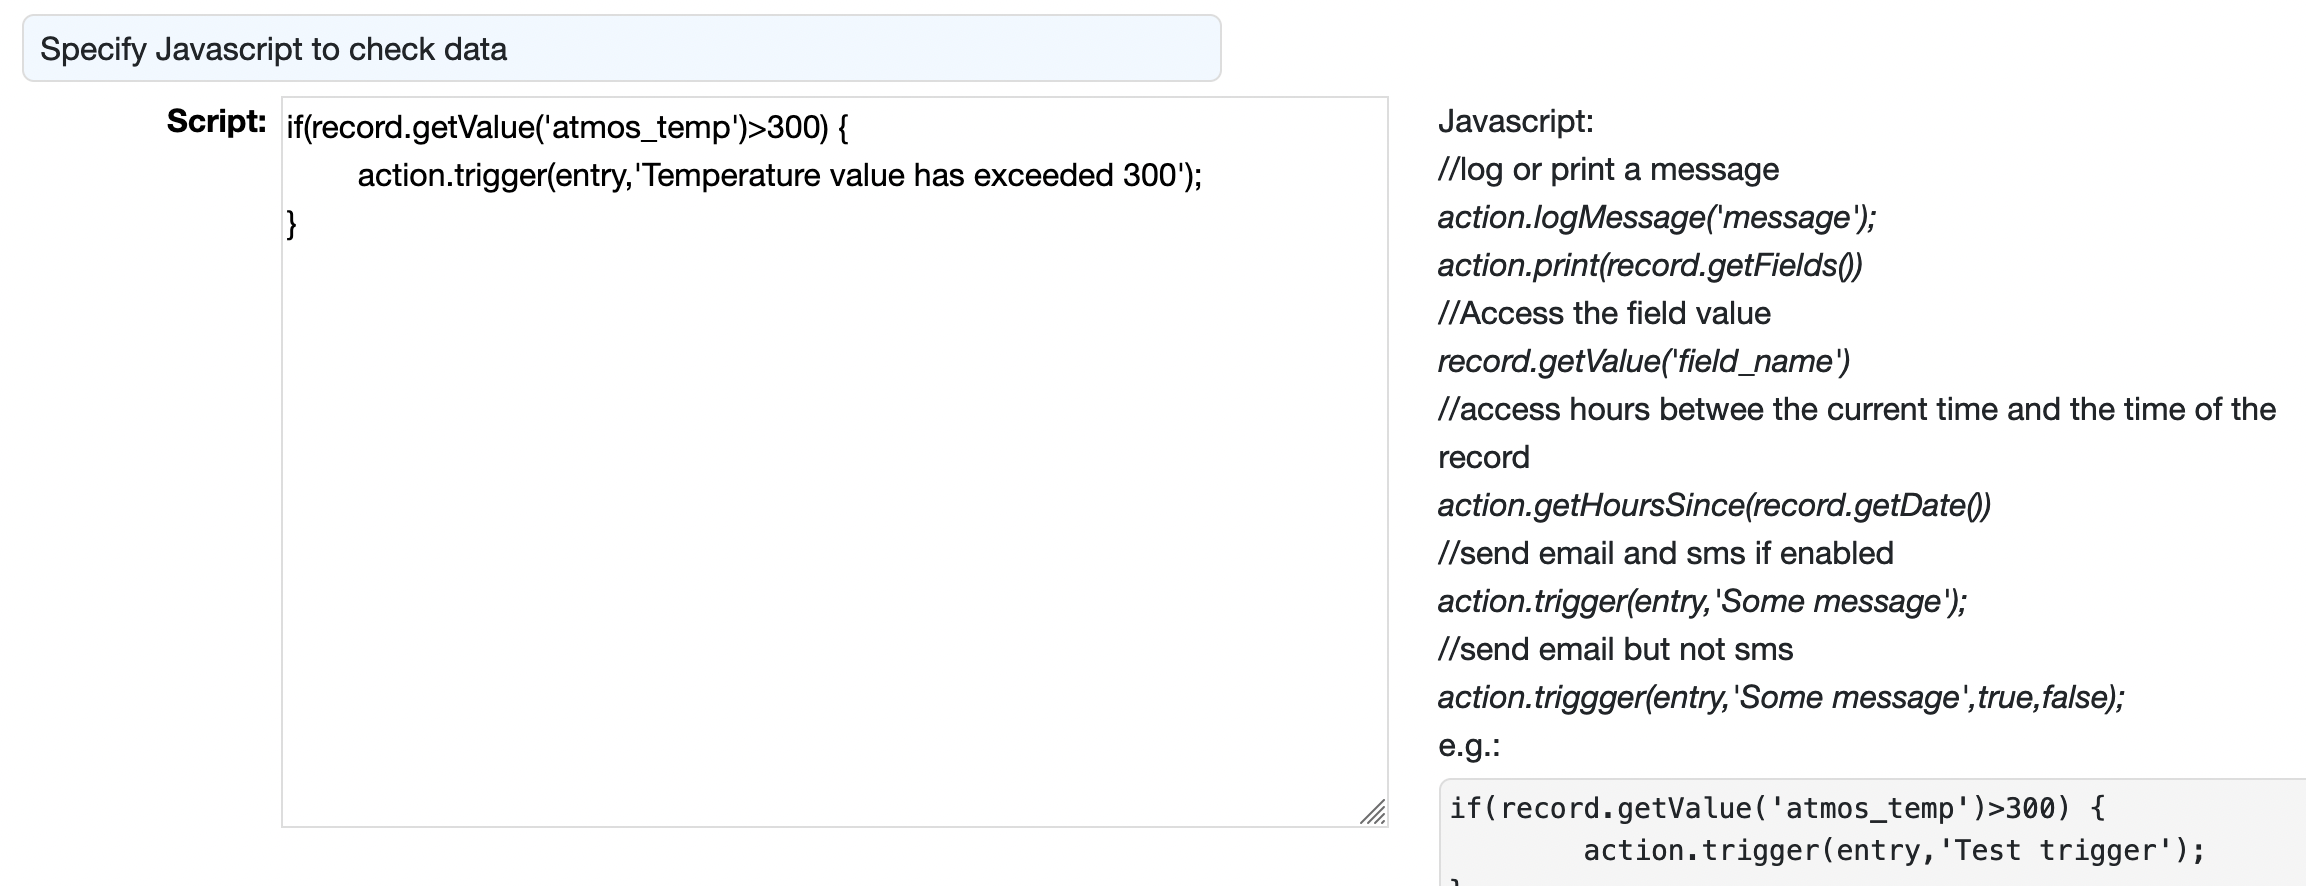
This example checks if the value of the "atmos_field" is > 300.
Note: The checks can be a combination of any valid Javascript code. If you want to have
a return you need to wrap the code in a function definition:
The names of the field can be accessed through the Metadata page of the corresponding entry. Alternatively,you can use the following code, select "Test" and Save the monitor. The results will be
shown at the top of the result page.
action.print(record.getFields())
Executing external program
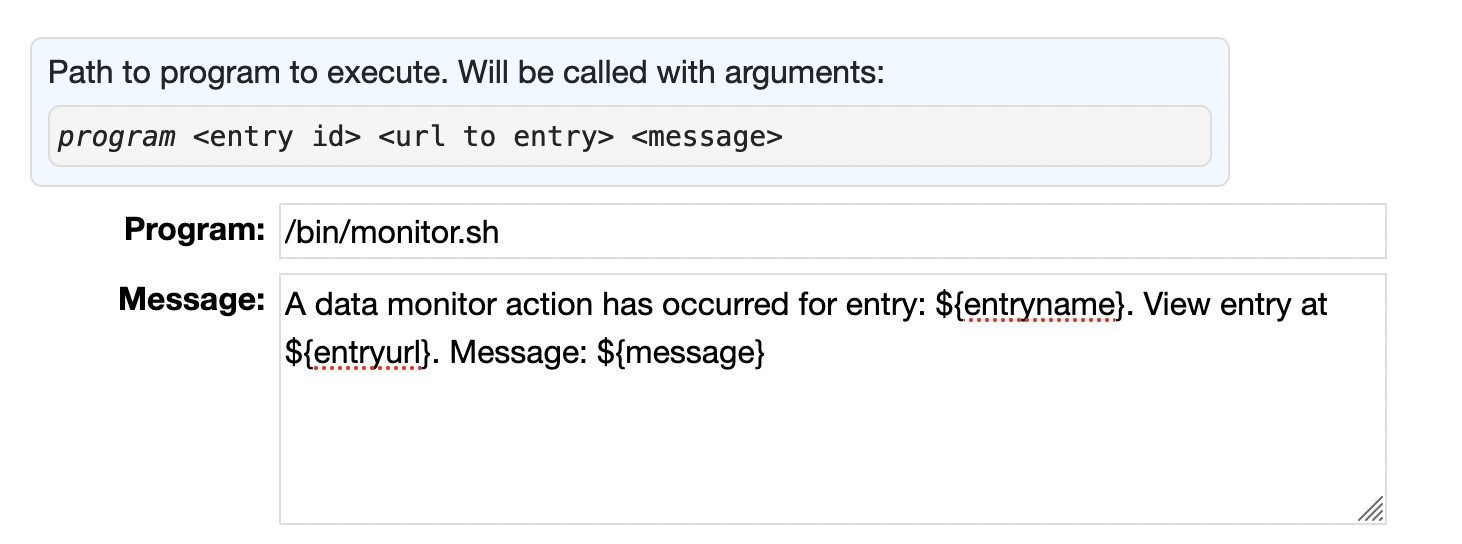
You can specify a path to an external program or script. This script is called with the
arguments:
program <entry id> <url to entry> <message>
| Note: For security RAMADDA will not just run the program specified. It has to be added
as a property in a RAMADDA .properties file:
#comma separated list of scripts that be executed by various services, e.g. the Data Monitors
ramadda.programs=/your/program
|
To send an email message your RAMADDA has to be configured with an SMTP server through the
Admin pages. Once configured you can entry one or more email
addresses in the Data Action. The Email Message is a template of the form:
A data monitor action has occurred for entry: ${entryname}. View entry at ${entryhref}. Message: ${message}.
Sending messages makes use of the phone RAMADDA plugin (which is in the default plugins).
Documentation is available at
https://ramadda.org/repository/phone/configuration.html.
To send text messages you need to create an account at
Twilio.
This includes an Application SID, Authorization token and an account phone number.
Twilio does have a process for ensuring your sending of text messages follows
regulations.
Once you have Twilio configured configure your RAMADDA with the following properties from Twilio:
#Twilio Application SID
twilio.accountsid=

#Twili authorization token (for reading the transcription)
twilio.authtoken=

#The phone number of your twilio account
#twilio.phone=
The text message can have its own message template or it will use the email template if not defined.
RAMADDA checks the Data Action Monitors by default every 5 minutes.
This can be changed by specifying the property:
ramadda.monitor.live.sleepseconds=number of seconds between checks
Logging of monitor actions is writtin out the the monitor.log file in your ramadda_home/logs directory and can be viewed through the Admin-Logs page.